
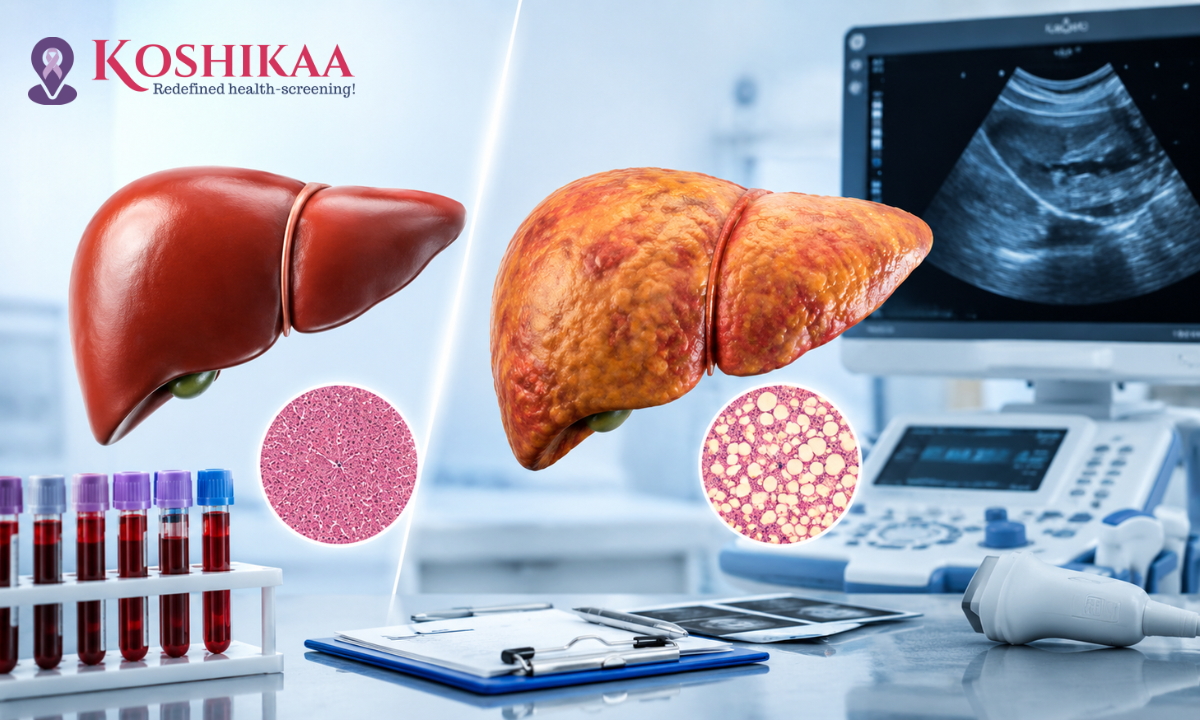
Maintaining a resilient metabolism requires keeping a close watch on your internal organs, especially the liver. Recognizing the silent onset of fatty liver disease represents a major milestone in preserving cellular function and preventing metabolic complications.
Scheduling a comprehensive wellness assessment at a state-of-the-art Health screening centre in Bangalore equips families with the precise diagnostic tools needed to identify early fat accumulation before it affects overall metabolic health. By tracking these subtle changes early, we can protect our vital systems, support long-term vitality, and make informed choices to ensure a vibrant future.
As the central clearinghouse for processing nutrients, filtering toxins, and regulating energy distribution, the liver continuously manages metabolic demands. However, when the intake of sugars, processed fats, and environmental stressors consistently exceeds the body’s energy requirements, the liver is forced to store excess energy as triglycerides within its own cells.
This cellular transition, historically referred to as non-alcoholic fatty liver disease (NAFLD), has been updated by international medical consensus to Metabolic Dysfunction-Associated Steatotic Liver Disease (MASLD).
This change in terminology highlights the direct connection between liver fat accumulation and broader cardiometabolic health, shifting the scientific focus toward proactive metabolic tracking.
As the liver has very few sensory nerve fibers within its deeper tissues, early-stage fat accumulation rarely causes localized pain or physical discomfort. This lack of sensory warnings often leads individuals to live with progressive metabolic imbalances for years without realizing their system is under strain.
Moving away from reactive diagnostics and learning to monitor early cellular shifts, we can intervene during the reversible stages of lipid accumulation, protecting our metabolic health and ensuring our vital organs function smoothly.
Medical Disclaimer
The physiological definitions, cellular breakdowns, and diagnostic matrices provided in this article are intended strictly for educational and health awareness purposes. This informational guide does not serve as a substitute for professional medical advice, direct clinical consultations, official diagnostic interpretations, or personalized therapeutic strategies. Metabolic and liver health conditions are highly complex and can share clinical features with a wide array of viral, genetic, or systemic disorders. Always consult a qualified hepatologist, gastroenterologist, or board-certified physician to evaluate your specific physical symptoms or diagnostic laboratory results. Never ignore, delay, or disregard professional medical guidance based on the educational concepts outlined in this document.
Cellular Underpinnings: What Happens During Steatosis
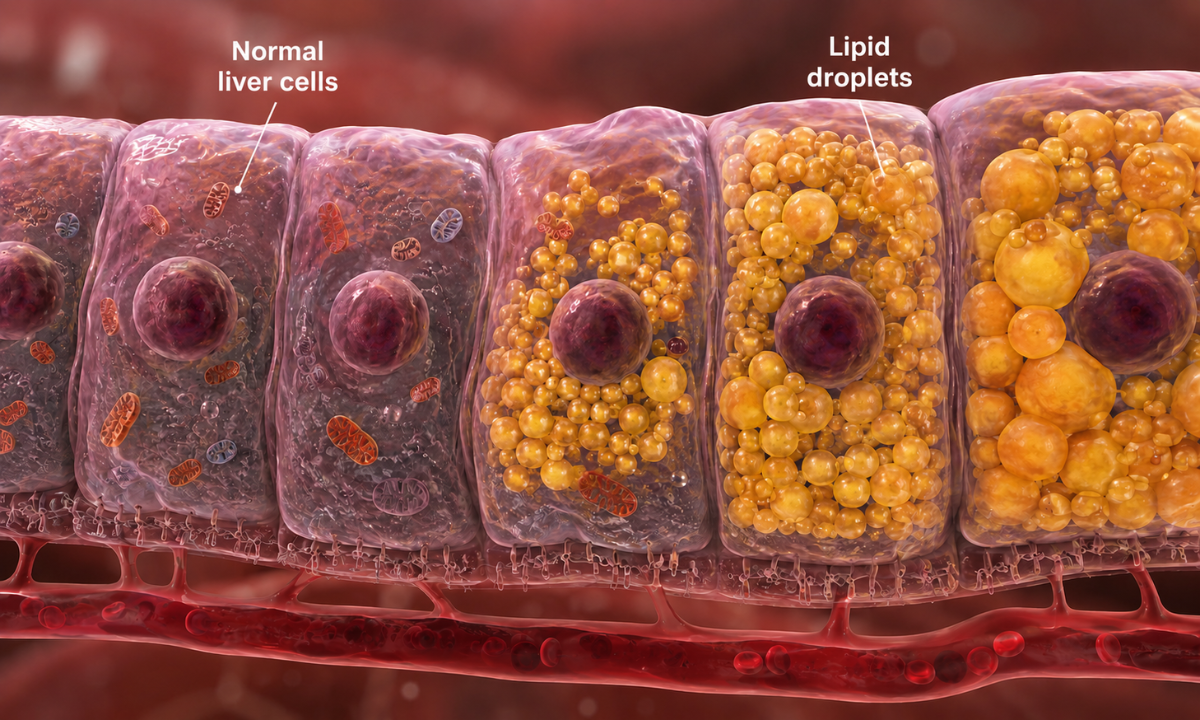
To truly understand how this metabolic condition develops, we must look past the superficial symptoms and examine the microscopic environment of the liver tissue.
The liver is composed primarily of highly specialized cells called hepatocytes, which are packed with mitochondria to fuel constant metabolic activity. Under normal physiological conditions, hepatocytes handle a continuous flux of lipids.
They take up free fatty acids from the bloodstream, synthesize them into neutral triglycerides, and either burn them for energy through a process called beta-oxidation or pack them into very-low-density lipoproteins (VLDL) to be exported and used by other tissues.
However, when chronic overnutrition, physical inactivity, or insulin resistance disrupts this delicate metabolic equilibrium, the hepatocytes are overwhelmed. Fatty acids flood the liver from two main sources: increased delivery from fat tissue (adipose lipolysis) and an abnormal acceleration of internal fat creation, known as de novo lipogenesis.
When the rate of fatty acid entry and creation far exceeds the liver’s capacity to burn or export them, the hepatocytes are forced to store the excess.
The Transition from Storage to Cellular Stress
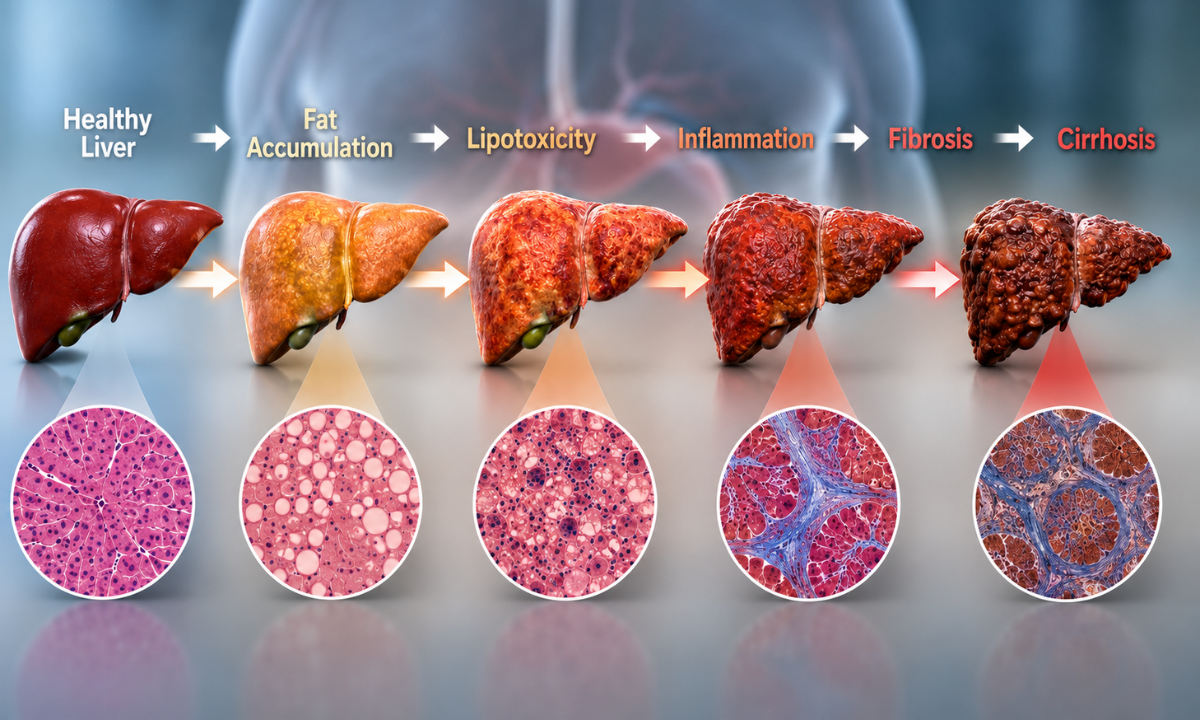
Initially, the liver cells attempt to protect themselves by converting reactive free fatty acids into inert neutral triglycerides. They store these triglycerides inside specialized intracellular compartments called lipid droplets.
As the lipid droplets expand in size and number, they push the hepatocyte’s nucleus to the edge of the cell membrane in a pathological state known as macrovesicular steatosis.
While simple fat storage is initially a protective adaptation, it becomes highly destructive if the metabolic overload persists. When the storage capacity of these lipid droplets is overwhelmed, highly reactive and toxic fat molecules begin to accumulate freely within the cell’s cytoplasm.
This marks the onset of lipotoxicity, which triggers several destructive cellular chain reactions:
- Mitochondrial Dysfunction: The cells’ powerhouses are forced to process an unsustainable volume of lipids, leading to a breakdown in their internal machinery, a drop in cellular energy (ATP) production, and the leakage of highly damaging free radicals.
- Oxidative Stress: The accumulation of free radicals damages the delicate proteins, lipid membranes, and DNA within the hepatocyte, accelerating cell injury.
- Endoplasmic Reticulum (ER) Stress: The cell’s protein-folding factory becomes overloaded, triggering a cellular distress signal that can eventually lead to programmed cell death.
As the structural scaffolding of the injured cell collapses, it swells significantly and takes on a rounded, empty appearance under a microscope, a classic hallmark of active cellular damage.
The Inflammatory Cascade
When hepatocytes undergo ballooning and eventually rupture, they release molecular danger signals into the surrounding tissue. These distress signals activate the liver’s resident immune cells, known as Kupffer cells, which quickly recruit circulating white blood cells to the site of injury.
This immune response initiates lobular inflammation, transforming simple, silent fat accumulation into active steatohepatitis.
If this active inflammation continues unchecked, it stimulates localized scar tissue production (fibrosis). Over time, this scar tissue replaces healthy liver architecture, potentially leading to irreversible cirrhosis.
As this cellular damage happens quietly and without pain, utilizing a highly precise fatty liver test during routine wellness checks is essential. It allows clinicians to identify metabolic stress early and intervene long before permanent physical scarring can establish itself.
Serological Panels: Deconstructing Biomarkers
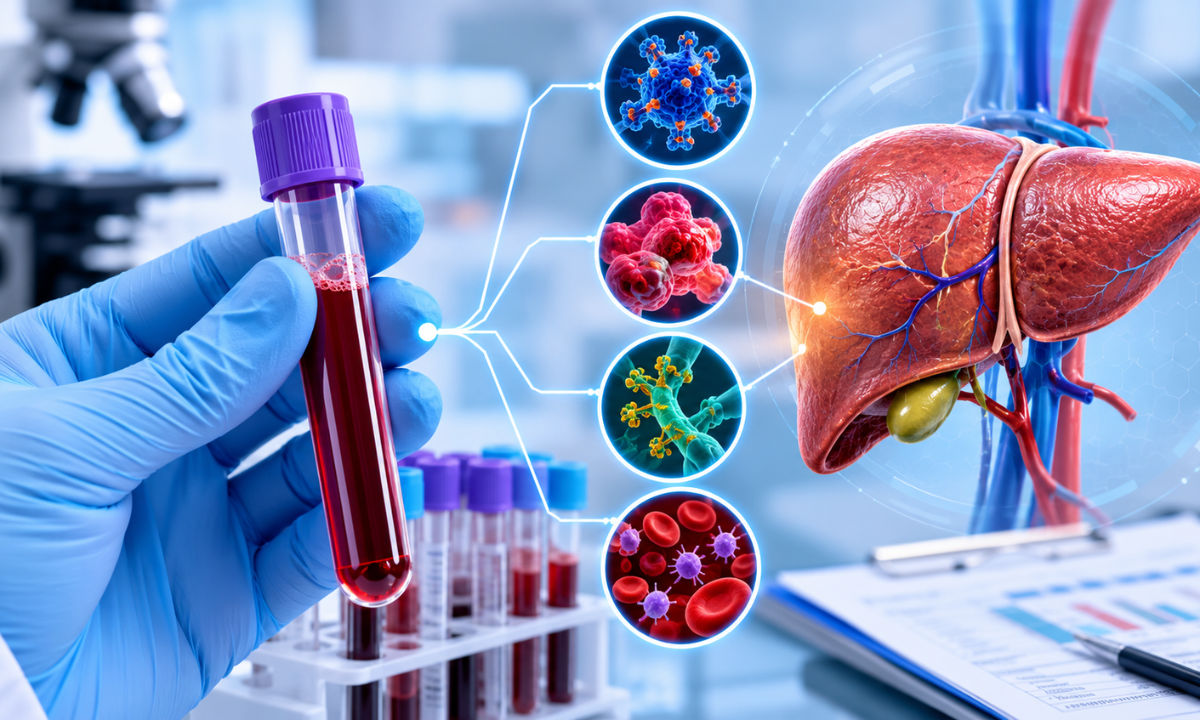
When evaluating hepatic health, blood chemistry provides a vital, real-time window into the metabolic state of your hepatocytes. As early lipid accumulation is physically silent, biochemical screening is the primary tool used to flag initial metabolic stress.
A routine liver function test is often the first biochemical step clinicians use to measure specific proteins and enzymes that circulate in your blood. When hepatocytes are structurally healthy, these enzymes remain safely inside the cell membranes to perform metabolic tasks.
However, when hepatocytes swell, undergo oxidative stress, or rupture due to lipid accumulation, their cell membranes become porous, allowing these intracellular enzymes to leak directly into the bloodstream.
By analyzing the concentration of these enzymes, clinical teams can gauge the level of ongoing liver cell stress and identify early metabolic changes.
The Transaminase Profile: AST and ALT
The primary markers evaluated in a basic metabolic screening are transaminases specialized enzymes that process amino acids within the liver cells:
- Alanine Transferase (ALT): This enzyme is found primarily inside liver cells, making it a highly specific indicator of direct liver tissue stress. When ALT levels rise in the blood, it usually signals that hepatocytes are actively leaking due to inflammation or mechanical swelling.
- Aspartate Transferase (AST): While AST is highly active in the liver, it is also found in cardiac muscle, skeletal muscle, and red blood cells. A combined rise in both AST and ALT suggests active liver cell injury, and comparing the ratio between the two (the AST/ALT ratio) helps clinicians understand the specific pattern of liver stress.
The “Silent LFT” Trap: A critical detail often missed in basic health screenings is that up to half of all individuals with early-stage fatty liver present with completely normal enzyme levels.
This happens as hepatocytes can slowly accumulate lipids over years without actively rupturing or leaking enzymes. Relying solely on standard enzyme levels can create a false sense of security, which is why modern preventive care looks beyond basic enzyme counts.
Beyond Enzymes: Advanced Risk Calculations
To overcome the limitations of standard enzyme tracking, advanced laboratories use comprehensive panel data to calculate your long-term liver health.
When opting for a specialized metabolic Blood test in Bangalore at a preventative laboratory like Koshikaa, your serum sample is analyzed using sophisticated risk-scoring algorithms that assess the overall state of your liver tissue:
- The FIB-4 Index (Fibrosis-4): This clinically validated formula estimates the risk of liver scarring (fibrosis) by combining your age, platelet count, AST, and ALT levels. As platelet counts naturally drop as liver scarring progresses, this simple calculation provides a highly reliable risk score without requiring invasive tissue biopsies.
- The APRI Score (AST to Platelet Ratio Index): Similar to FIB-4, the APRI score compares your AST levels to your total platelet count to flag early structural tissue changes. It helps identify individuals who need advanced imaging or targeted lifestyle adjustments.
- Gamma-Glutamyl Transferase (GGT): This sensitive enzyme is heavily involved in the liver’s antioxidant defense systems. Elevated GGT levels often act as an early warning sign of oxidative stress, signaling that the liver is actively struggling against lipid-induced free radicals.
Combining standard enzyme monitoring with advanced risk calculations, metabolic screenings provide a highly accurate map of your liver health. This dual approach ensures that even silent, non-leaking lipid accumulation is identified and managed long before it can affect your long-term metabolic vitality.
Structural Screening: Conventional Scans
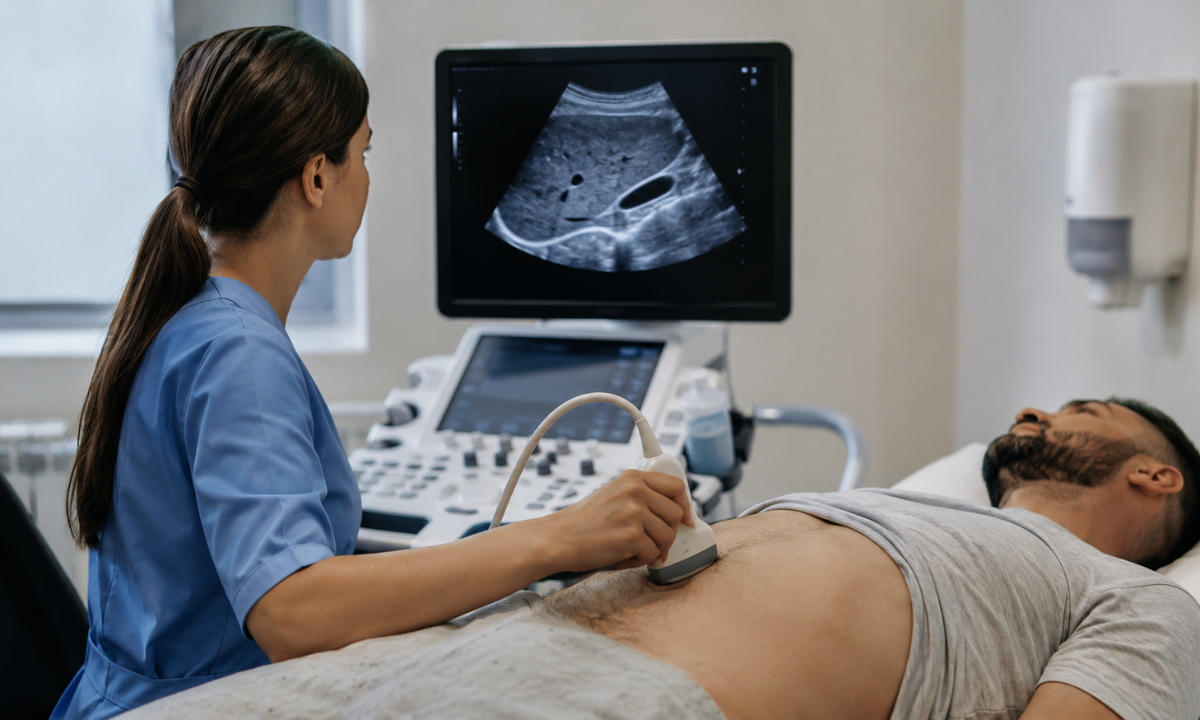
While blood chemistry offers a window into localized cell injury, validating the actual presence of lipids inside the tissue requires structural visualization. Clinical teams rely on a suite of non-invasive imaging tests for fatty liver to assess how deeply fat accumulation has impacted the physical volume and tissue density of the organ.
These imaging tools send high-frequency waves through the body to create a physical map of the abdominal cavity, helping clinicians distinguish healthy, uniform liver tissue from tissue that is structurally altered by stored lipids.
Understanding Acoustic Wave Behavior
The most common starting point for structural imaging is a standard Abdominal ultrasound. This tool functions by emitting sound waves from a handheld transducer into the upper right quadrant of your abdomen.
As these waves travel through the body, they bounce off the internal organs and return to the receiver, creating a real-time grayscale image of your anatomy based on tissue density:
- Healthy Liver Tissue: Sound waves travel easily through normal, water-rich hepatocytes, reflecting off deeper structures with uniform, moderate gray tones.
- Steatotic Liver Tissue: When hepatocytes are packed with microscopic lipid droplets, the physical density of the tissue changes.
Fat is highly reflective (hyperechoic) to sound waves. As a result, acoustic waves bounce off these lipid droplets rapidly, making the liver appear abnormally bright or white on the screen compared to nearby organs.
Analyzing the Progression Matrix
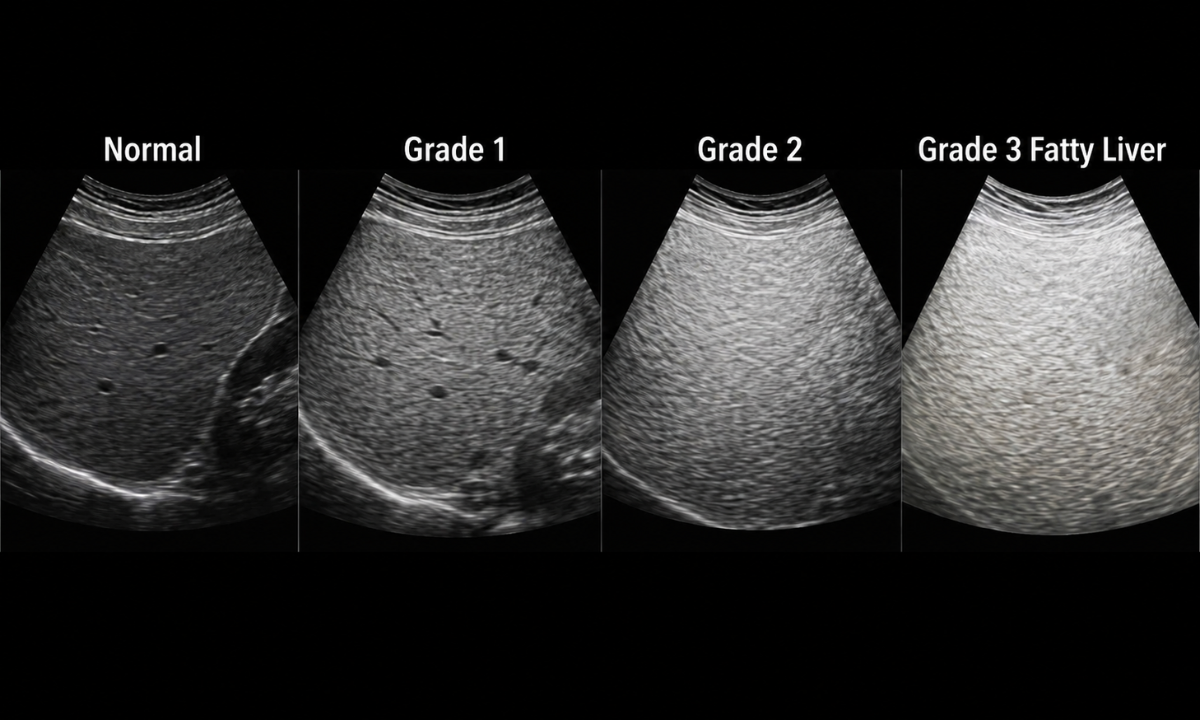
As shown in the comparative scan analysis above, radiologists classify the severity of lipid accumulation by looking for specific visual cues relative to surrounding anatomical landmarks:
- Normal: The liver tissue presents with a soft, uniform gray texture. Its brightness is equivalent to or slightly lower than that of the adjacent right kidney (labeled as RK on the scan), and deep vascular structures like the inferior vena cava (IVC) are clearly visible with sharp, distinct margins.
- Grade 1 (Mild): The tissue exhibits a slight increase in brightness (echogenicity). While the liver appears marginally whiter than the RK, the acoustic waves can still travel deep into the abdomen, leaving the diaphragm and the walls of the IVC clearly defined.
- Grade 2 (Moderate): There is a moderate, widespread increase in echogenicity. The contrast between the bright liver tissue and the darker RK becomes highly pronounced, and the deeper blood vessel walls (like the IVC) begin to appear fuzzy or partially obscured as the sound waves are scattered by the fat.
- Grade 3 (Severe): The liver tissue appears intensely bright and highly reflective. As the massive accumulation of lipids blocks or scatters almost all the incoming sound waves, there is severe acoustic attenuation.
The deeper portions of the liver, the diaphragm, and the vascular structures like the IVC are completely obscured or invisible on the scan.
The Technical Limitations of Basic Scans
While standard grayscale imaging is an invaluable, accessible tool for identifying moderate-to-severe lipid changes, it has distinct physical limits. It cannot reliably identify early-stage fat accumulation if the total lipid volume is less than 20% to 30% of the liver’s weight.
Furthermore, a basic scan cannot tell the difference between simple, harmless fat accumulation and active tissue inflammation, nor can it accurately measure the presence of microscopic scar tissue (fibrosis).
To overcome these visual limits, clinicians pair conventional scanning with advanced, quantitative wave technology to measure exact tissue stiffness and fat percentages.
High-Precision Elastography: Evaluating Tissue Stiffness
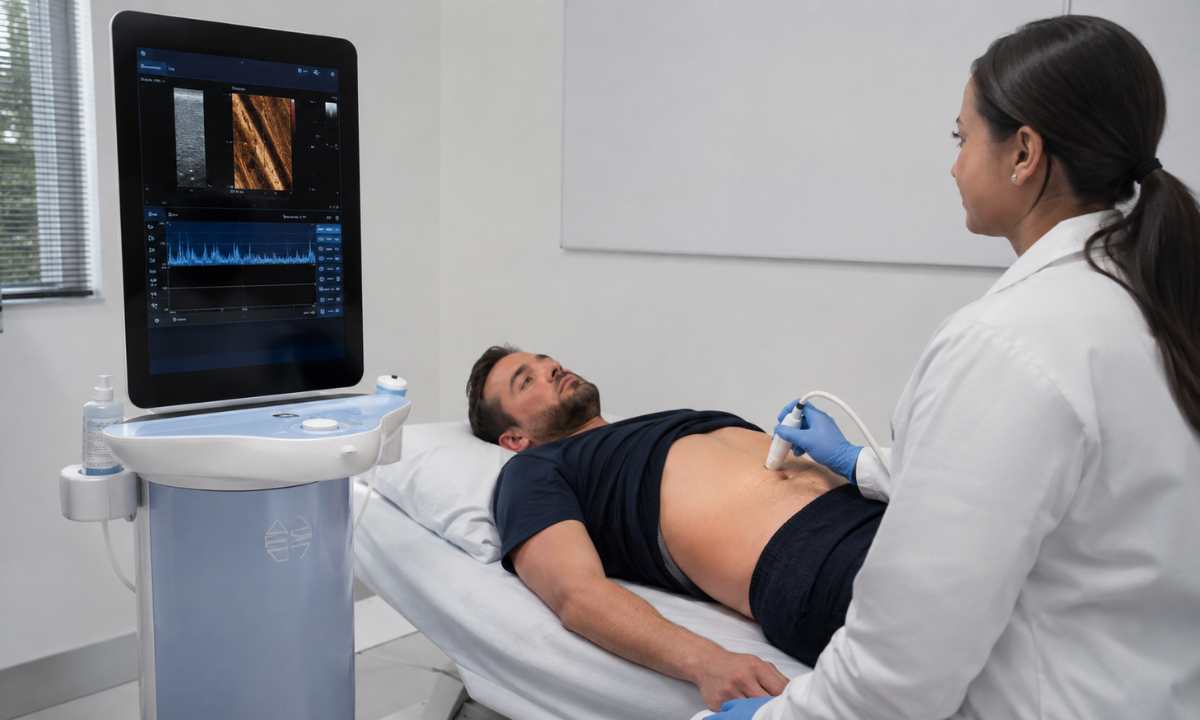
While conventional imaging provides a general visual overview, accessing an advanced, high-precision Ultrasound scan in Bangalore at Koshikaa’s diagnostic facility allows patients to undergo transient elastography, which measures both fat percentage and tissue stiffness simultaneously.
This cutting-edge, non-invasive technology bridges the gap between basic visual scans and invasive surgical biopsies, giving clinical teams the ability to track metabolic progression with quantitative precision.
To understand the physical mechanics of this technology, think of tapping a drum. If the drum skin is loose and flexible, the vibrations move slowly and disperse gently. If the skin is stretched incredibly tight and rigid, the vibrations travel across the surface at high speed. Transient elastography operates on this exact physical principle.
The device sends a painless, low-frequency sound wave (a physical vibration) through the liver tissue, followed immediately by an acoustic tracker that measures the velocity of the resulting shear wave.
The Dual-Reporting Diagnostic Framework
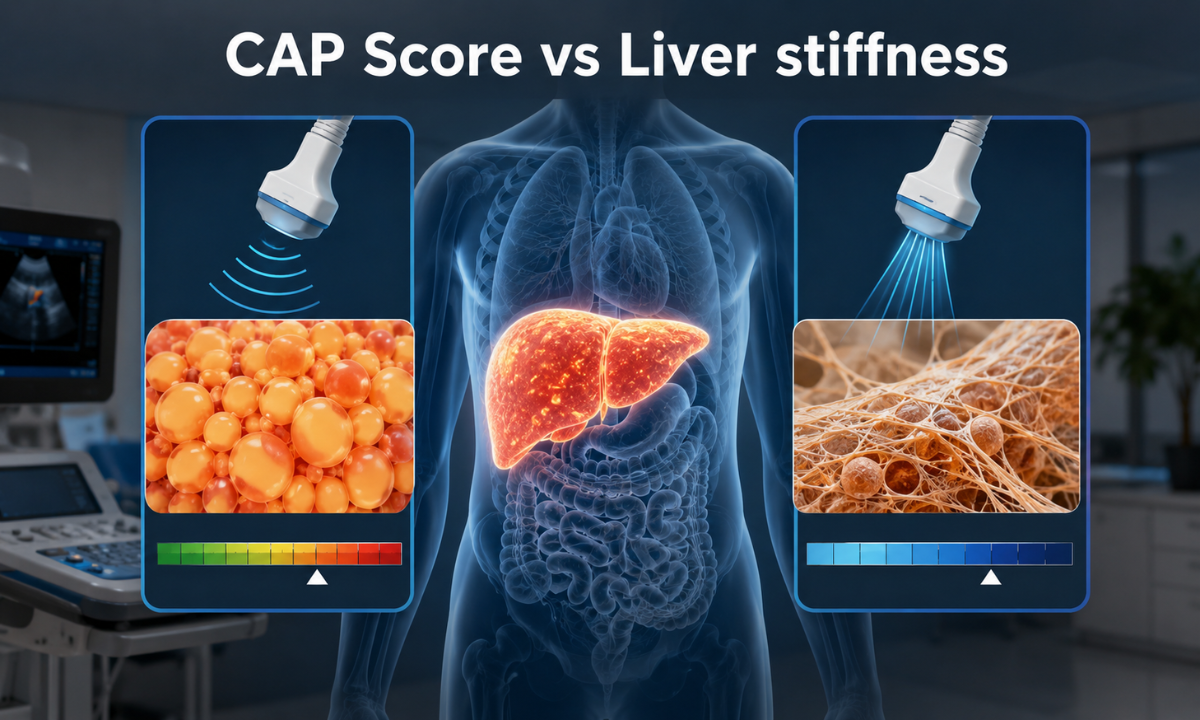
Unlike basic sonography, which relies on subjective visual assessments of “brightness,” elastography delivers two distinct, objective numerical scores that map different aspects of hepatic health:
- Controlled Attenuation Parameter (CAP) Score: This metric measures how much the ultrasound wave weakens (attenuates) as it travels through the liver. As fat cells block and scatter sound waves more than healthy tissue, a higher rate of wave weakening corresponds directly to a higher percentage of fat inside the hepatocytes. CAP is measured in decibels per meter (dB/m).
- Liver Stiffness Measurement (LSM): This metric tracks the speed of the shear wave to calculate the physical elasticity of the liver tissue.
As scar tissue (fibrosis) is highly rigid, shear waves travel much faster through a scarred liver than a healthy, flexible one. LSM is calculated in kilopascals (kPa).
Quantifying Hepatic Health: The Elastography Reference Matrix
| Measurement Metric | Score Range / Grade | Clinical Interpretation | Pathological Significance |
|---|---|---|---|
| CAP Score (Steatosis) | Less than 238 dB/m | S0: Normal | Healthy tissue; no significant fat accumulation in hepatocytes. |
| 238 to 260 dB/m | S1: Mild Steatosis | Up to 11% to 33% of hepatocytes contain microscopic lipid droplets. | |
| 261 to 290 dB/m | S2: Moderate Steatosis | 34% to 66% of liver cells are structurally altered by stored triglycerides. | |
| Greater than 290 dB/m | S3: Severe Steatosis | Over 67% of hepatocytes are packed with fat, compromising cell function. | |
| Stiffness Score (Fibrosis) | Less than 7.0 kPa | F0 to F1: No / Mild Fibrosis | Normal elastic tissue; negligible or very early scar formation. |
| 7.0 to 8.7 kPa | F2: Moderate Fibrosis | Initial bridging fibrosis; scar tissue starting to expand around blood vessels. | |
| 8.8 to 10.3 kPa | F3: Severe Fibrosis | Advanced structural scarring: liver tissue is becoming rigid and less functional. | |
| Greater than 10.3 kPa | F4: Cirrhosis | Extensive, irreversible structural scarring with nodule formation. |
The Clinical Advantage of Elastography: As elastography can detect minute structural changes before they are visible on standard scans or reflected in routine blood enzyme levels, it acts as an early-warning system.
Identifying an elevated CAP score while the stiffness score remains in the F0 to F1 range allows individuals to make targeted dietary and lifestyle changes, reversing fat accumulation before permanent structural tissue damage can establish itself.
Why Choose Koshikaa for Preventive Cellular Screening?
Prioritizing your metabolic health requires a partnership with a diagnostic team that understands wellness at its most foundational level. At Koshikaa, our preventive philosophy is built around the deep study of cellular integrity and metabolic function.
We believe that true medical empowerment means identifying subtle internal physiological changes long before they develop into chronic wellness challenges. Our advanced facility in Banashankari provides individuals and families with a precise, seamless environment to evaluate their biological baselines with absolute confidence.
Our preventative care framework stands apart through several dedicated service standards:
- Tailored Age-Wise Risk Profiling: We recognize that your metabolic risks and diagnostic needs evolve. Instead of offering generic, uniform checkups, we design highly personalized screening protocols based on your distinct life stage, daily habits, and genetic family history.
- Integrated Multi-Modal Diagnostics: Our center combines automated laboratory processing of blood chemistry with advanced imaging technology. This dual approach ensures that your cellular metabolic markers and physical organ structures are analyzed simultaneously, providing a high-resolution map of your internal health.
- Proactive Focus on Cellular Health: Guided by our name, derived from the fundamental building block of life, the cell, our clinical pathways are focused entirely on early identification. We catch subtle biological red flags early, allowing for simple, highly effective lifestyle adjustments and medical guidance.
- Eliminating Scanning Anxiety: We understand that visiting a diagnostic clinic can feel overwhelming. Our facility is deliberately designed to provide a calm, reassuring, and highly supportive atmosphere, transforming essential health checks into a stress-free component of your annual wellness routine.
Partnering with a team focused on early, non-invasive metabolic quantification, you gain a clear and accurate understanding of your cellular health, helping you make proactive choices for long-term vitality.
Conclusion
Maintaining clear, healthy metabolic function relies on proactive tracking rather than waiting for physical discomfort to appear. Understanding how fat accumulation begins at a cellular level and how modern non-invasive technology maps these changes allows you to manage your metabolic health with complete clarity. By keeping a close watch on your cellular baselines and understanding the dynamics of organ fat storage, you protect your body’s vital metabolic engine and your long-term wellness.
True prevention means acting when your body is at its strongest. Partnering with dedicated specialists to build a documented record of your metabolic health ensures that minor internal shifts are identified and managed swiftly. Invest in your peace of mind by scheduling a comprehensive evaluation today, securing a vibrant, active, and uncompromised future.